At the end of 2016, the Electoral Integrity Project, an organization run by Dr. Pippa Norris, released a report which scores the quality of each state's elections. The purpose of the study is to inform researchers and other interested parties how democratic each state is– how well government policies reflect public beliefs and values.
To understand the quality of elections, the EIP collected surveys from 726 experts on a variety of topics, including electoral laws, ease of voter registration, and balloting facility characteristics by state. From their 49 question survey, the EIP constructed the standardized Perceptions of Electoral Integrity (PEI) Index and calculated it for each state during the month after the 2016 US Presidential Election.
Using the data from the EIP report, I began exploring various public data sources to understand what factors are important when considering electoral integrity. I settled on data from the American Community Survey and the US Census. I also used data from a 2013 Williamson/Gallup poll on LGBT identification.
Electoral Integrity Project State Democracy Ranking
Demographics
While looking through various demographics collected by these organizations, I found four important factors: total state population, economic disparity, net international migration, and solely white population.
Total state population is the estimated population of each state in 2015. Economic disparity, defined by a measure called the GINI index, is how exponential the difference in wealth between citizens of a state is. Larger numbers indicate more extreme differences between poorer and richer citizens.
Net international migration is how many people have legally settled in the state from another nation subtracted by how many people have moved out of the United States after living in said state. A positive number indicates that migrants are moving into the state.
The solely white population is the portion of the population that lists their race as white, and only white.
These factors, and the interactions between these factors, account for 29% of the variance in PEI indices by state. This means that these four variables can be used to explain between a fourth and a third of the differences between states’ PEI scores.
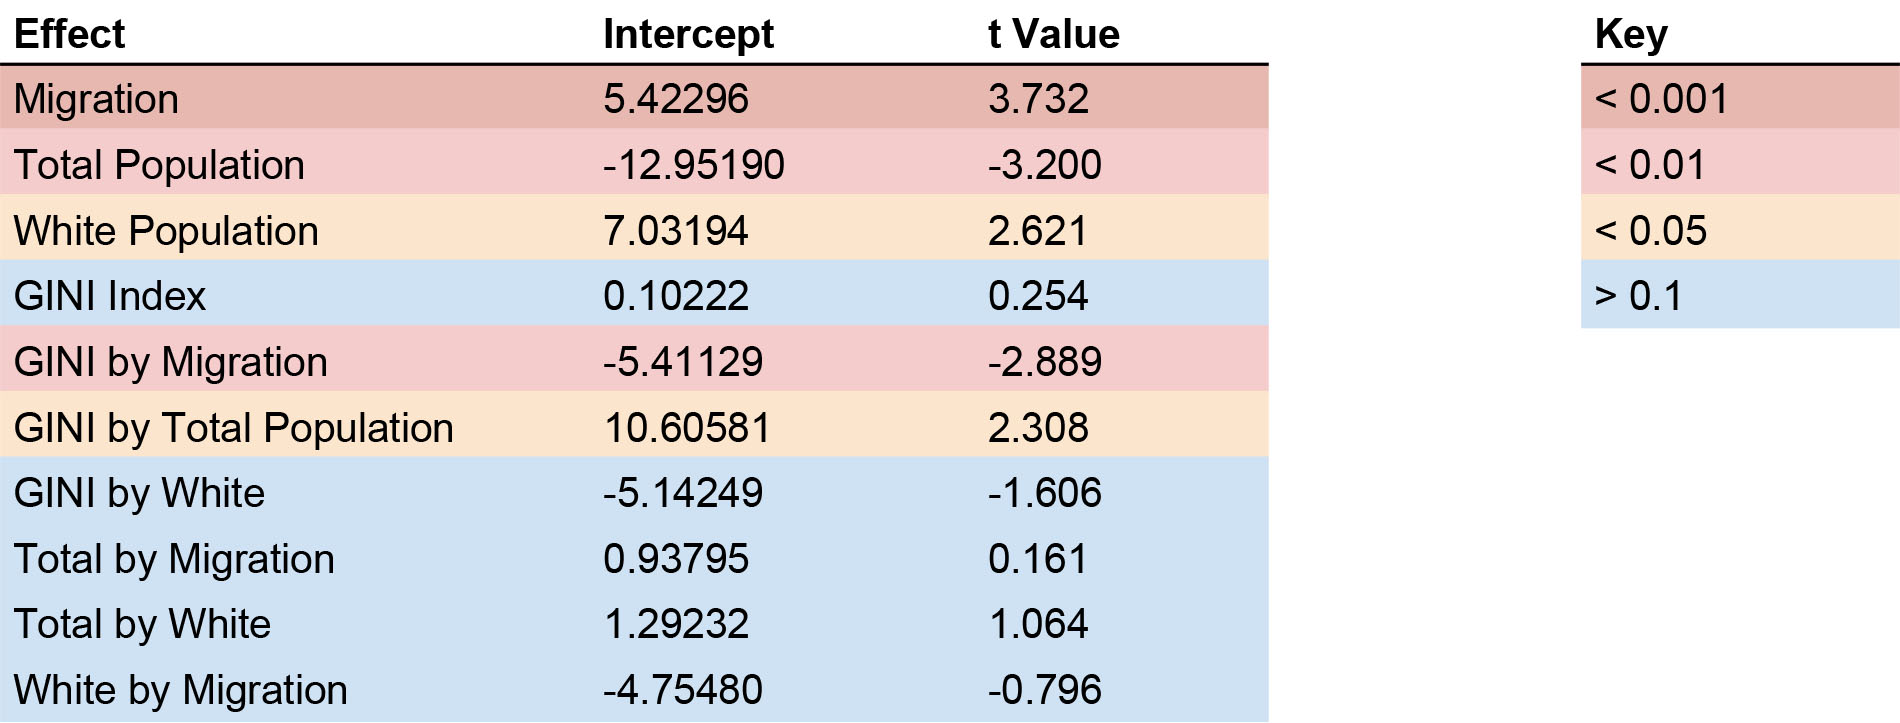
Description: Multiple regression of electoral integrity for each state by net migration, total population, white population, and economic disparity as measured by the GINI index (F(15,34)= 2.34, p = .02, R^2 = 0.29). All 3- and 4-way interactions were insignificant and were thus excluded. Probability values are color-coded (see key).
There were significant main effects for net migration, total population, and white population. The most statistically robust finding was that electoral integrity increases as a function of the number of migrants in a given state (b = 5.42,t = 3.732, p < .001). Meanwhile, as the total population size of a state increases, the electoral integrity of the state decreases (b = -12.95, t = 3.20, p < .01). The more white residents of a state, the higher the electoral integrity of the state (b = 7.03, t = 2.62, p < .05). Thus, both highly populous and racially diverse states were found to have weaker democracies, while states that accepted more international migrants tended to have stronger democracies (though the positive effect of larger migrant populations was smaller than the negative effect of smaller white populations on electoral integrity). In this data, no direct relationship of economic disparity on electoral integrity was found.
However, significant interactions occurred between economic disparity and both migration and total population. The interaction between net migration and economic disparity was negative (b = -5.41, t = -2.89, p < .01), meaning that as the number of immigrants and the economic disparity both increased, elections were less democratic. This suggests that places with large numbers of incoming migrants and a lot of unevenly distributed wealth have worse elections. However, the interaction between economic disparity and total population was positive (b = 10.61, t = 2.308, p < .05).
While trying to develop an interpretation of these findings, I considered that median income may be confounding our measure of income inequality– places with a few incredibly wealthy people could also have higher median household incomes. However, no correlation was apparent between median household income and income inequality by state (r(49) = 0.62, p = 0.54); no obvious confound is apparent to me.
Income inequality is associated with worse elections in states that receive a large number of migrants, but is associated with more responsive democracies when population increases.
From the main effect of population on PEI index, we know states with large populations are worse at representing the interests of their residents. Low-population states and unusually white states have relatively strong democracies– likely because there are fewer social divisions that could lead to differing political opinions. High-population states, which in general do a poor job of representing their residents, may rely on unique characteristics of cities to maintain their democracies: income inequality doesn't directly affect electoral integrity, but when income inequality and total population both increase (as it large cities), electoral integrity is higher.
An intuitive interpretation of this data suggests that democracy is easy when almost everyone wants the same things, but is more challenging in states with more diverse population and differing needs. If large cities are where both net migration and population are high, then “diversity” is not the sole determinant of a successful democracy in the face of discordant public interests; rather, “density” is what combats the general trends towards less effective elections in states with larger populations. Whether or not cities are really the crux of this phenomena will have to be tested in further research.
Density is what combats the general trends towards less effective elections in states with larger populations.
LGBT Population and Democracy
While considering urban areas, I wondered if non-heteronormative populations– which exist in higher proportions in cities– might be a useful predictor for understanding electoral quality. Hypothesizing that queerness may exist in more democratic environments, I attempted to add the percentage of participants who identified as LGBT from a 2013 federal poll by Gallup and the Williamson Institute– the most robust measure of national non-heteronormative population density I am aware of– to the model. However, its inclusion decreased the effectiveness of our model (F(18, 31)= 1.41, p = 0.22, R^2 = 0.21). No relationship exists between electoral integrity and LGBT identification– there is no clear connection between democracy and queerness.
There is no clear connection between democracy and queerness.
Frankly, this finding surprised me. I posit these possible reasons for the lack of a relationship:
LGBT voters are not systematically disadvantaged by restrictive conditions for voting, and resident LGBT people do not play a major role in promoting democracy at the state level. While People of Color have historically been disenfranchised by discriminatory voter suppression laws (and states with more People of Color continue to have weaker elections, as we found in this analysis), LGBT people have not.
Relatedly, LGBT-identifying individuals may have their perceptions of elections shaped by their parents, as most children tend to inherit their parents' political beliefs. Thus, gender and sexuality may not be relevant to the voting habits and perceptions of these populations and LGBT people may relate to state governments in very similar ways to their straight counterparts. LGBT identification is unrelated to democracy and the efficacy of elections. Anecdotally, New York City Mayoral Candidate Christine Quinn's lukewarm popularity among LGB voters in 2013 supports the claim that there is no LGBT voting profile or unifying voting experience.
LGBT suppression, while intrinsically antidemocratic, may give the illusion of democracy via representivity: for example, North Carolina's "Bathroom Bill" (which was considered discriminatory to trans and gender-nonconforming individuals) may have energized voters who felt otherwise out of touch with federal and state governments' recent wave of legal protections for LGBT people. Judith Butler has described succinctly how even popular measures of discrimination are never democratic, but the effects of discrimination in practice are less clear. We have established that democracies function most easily when they serve relatively homogenous populations; divisive legislation that scapegoats a small minority could bring together an oppressive majority that emulates democracy, which could drown the relationship between LGBT populations, discrimination, and electoral integrity in noise and echos.
Divisive legislation that scapegoats a small minority could bring together an oppressive majority that emulates democracy
LGBT identification may not have been accurately reported in the 2013 poll (as these kinds of naturalistic, national polls are prone to various sampling biases), or other methodological concerns from the variety of large-scale datasets that were studied could be misdirecting our analysis.
The last possibility is the most seductive and the least supported. Intuitively, the association between democracy and personal freedoms, especially in the domain of identity, seem heavily intertwined. Are they actually disconnected? If so, what untraversed distance exists between LGBT identification and electoral integrity? The leftist histories of LGBTQ grassroots campaigns have left indellible marks in the laws and history books of the world's democracies; 92% of LGBT adults said that society has been noticeably more accepting of us in a 2013 PEW poll and, as of 2014, LGBT people are at least as likely as the general population to be politically active. What accounts for the disparity between these histories of activism and progress and the total disconnect between electoral integrity?
Of course, the lack of relationship between electoral integrity and LGBT identification can be perceived as a good thing– unlike with People of Color, there is no evidence in this data of systemic disenfranchisement of LGBT people at the ballot. Is that it? Is our finding that LGBT people have no influence on democracy because we are not immediately threatened and thus take no action?
More populous and diverse states generally struggle to listen to their people as well, cities may be the site of something that increases the quality of elections.
Ultimately, this analysis demonstrated that very white states without a lot of people and a large number of incoming migrants tend to have better elections. While more populous and diverse states generally struggle to listen to their people as well, cities may be the site of something (maybe increased drives for cooperation and conversation, or more established government infrastructures for elections) that increases the quality of elections. Currently, the proportion of a state who identifies as LGBT bears no relation to the quality of the state’s elections. As a queer person, this analysis has suggested to me that my friends and I would do well to prioritize electoral integrity in our political activity– while LGBT identification is not a perfect proxy for gender and sexual minorities’ political activity or prominence, I expected some relationship to exist. Human rights are intersectional, and the promotion of a more democratic America is, and, frankly, should have already been, a major priority– for queer people, and for all Americans.